 Gandor
Human Data.
Real Safety.
True Efficiency.
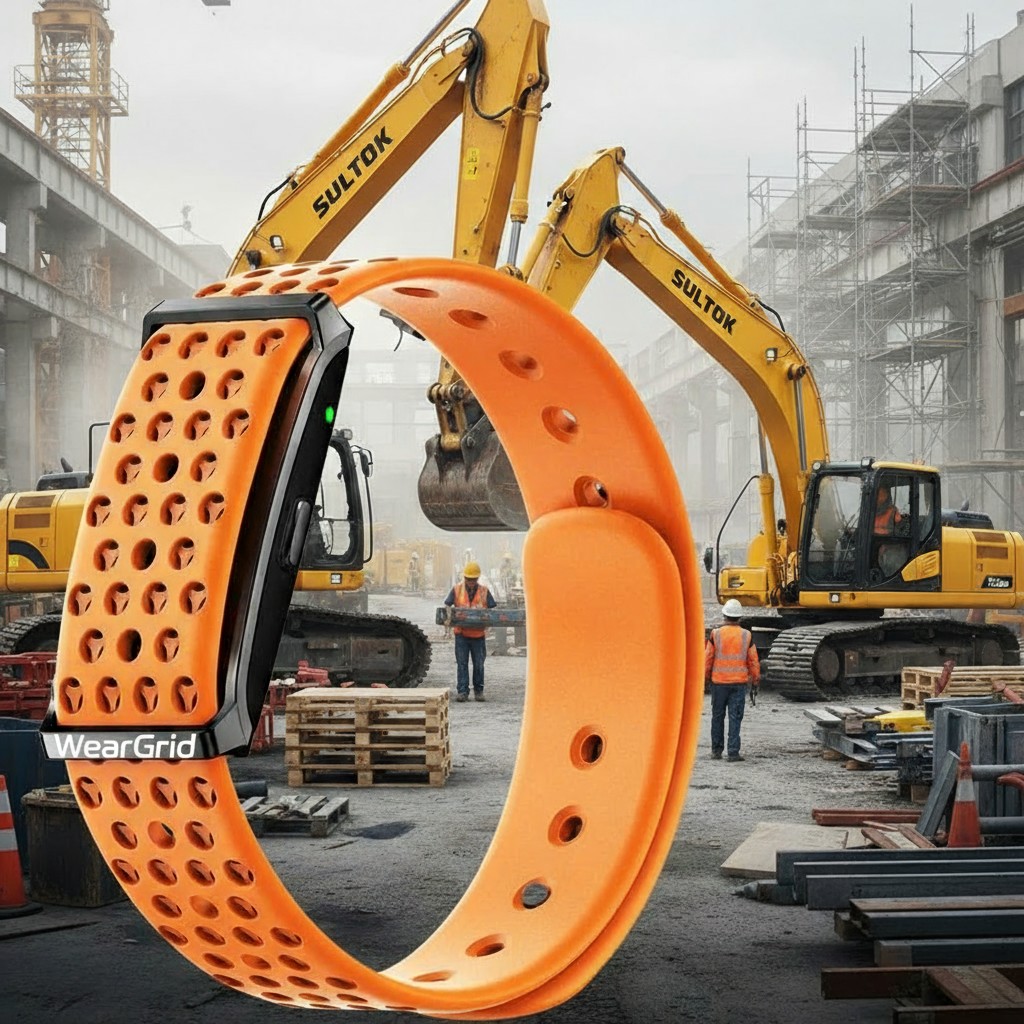
A digital labor-data network connecting people, process and technology. Minimalist wrist devices capture fatigue, sobriety and location signals in real time — turning every shift into data that keeps workers safe and projects on rhythm.
Every day, sites lose their most critical resource: reliable data
Fatigue turns into incidents
Overexertion drives micro-injuries and accidents — with no early warning before it happens.
No response to overload
Physical strain builds silently — supervisors find out only after something goes wrong.
No real efficiency data
Without reliable time-and-motion data, there is no way to see what's actually working.
People and process, disconnected
Crews and operations run without shared visibility — so nobody sees the full picture.
A smart solution for managing labor safety
Wearable devices
Minimalist, rugged bands with an optional dot-matrix display capture biometric and behavioral signals — including real-time alcohol and substance levels.
Smart analytics
The system turns raw signals into three metrics that matter: fatigue, activity and safety — updated continuously through the shift.
Real-time management
Supervisors get live analytics, workers get feedback and growth insight — and impaired workers are automatically blocked from hazardous zones and equipment.
Human Data. Real Safety. True Efficiency.
We build a digital network between people and process, where wearable data helps employers and workers operate more safely, recover faster and earn more — by managing energy and time deliberately.
Safety
Sobriety, fatigue and heat-stress control — access to hazardous zones is blocked automatically.
Recovery
Personalized rest, nutrition and shift-timing recommendations for every worker.
Productivity
Real-time activity and shift-efficiency analytics to spot and remove bottlenecks.
Transparency
Objective data for employers, fair, measurable performance for every worker.
Injury statistics: the key risk factors
Workplace accidents are rarely caused by one thing — ambient temperature and worker fatigue combine to drive most of the risk on site.
Heat & injuries
Higher incident risk for every 5°C above normal ambient temperature.
Overexertion
Increased error and injury probability once a shift runs past 8 hours.
Recovery gap
Insufficient recovery time meaningfully raises injury risk and lowers output.
From wrist to dashboard, in one data loop
Smart bands
BLE-compatible sensors, minimalist and rugged, with an optional dot-matrix display.
Local BLE gateways
On-site data collection and positioning.
WearGrid Cloud
Analytics and secure storage.
Interfaces
Supervisor dashboard and a mobile app for every worker.
Applied across the sectors Gandor serves
| Sector | Focus | Value |
|---|---|---|
| Construction | Safety, fatigue and location control | Fewer injuries, steadier work rhythm |
| Logistics / warehouse | Route optimization, load analysis | Higher efficiency, less downtime |
| Industrial | Shift analytics, energy and heat load | Managed performance and recovery |
What supervisors see, in real time
A simplified look at the WearGrid dashboard — live worker status across the site, updated continuously through the shift.
Powerful analytics, a clear interface
Live site map
Real-time position of every worker and zone on the site.
Color-coded status
Instant read on condition: normal / overloaded / incident.
Reports & metrics
Detailed reporting by shift, worker and KPI.
Smart alerts
Alarms and personalized recommendations before problems escalate.
Live in four steps
Pilot launch
Tested on 10–20 workers at a single site to prove impact.
Metric tuning
System calibrated to your operation and safety requirements.
Integration
Connected to existing ERP and HR systems for one shared record.
Scale-up
Rolled out across every site, with full technical support.
A flexible way to get started
SaaS subscription
Priced per active worker — transparent and predictable.
Devices
Rent or buy rugged bands and gateways, in the format that suits you.
Customization
Adapted to your industry and specific requirements.
AI analytics
Optional AI modules and deeper system integration.
WearGrid inside Gandor
WearGrid is the wearable layer of Gandor's digital HR monitoring — the real-time safety data referenced across our UAE track record, now available as its own deployable platform.
Paired with VizionGrid's aerial site monitoring, it gives a project full visibility — from the ground up and the sky down.